1. Export MC data from Cadence
In ADE result, select Detail-Transpose.
Tools -> Export Data
2. Improt data in Matlab and plot MC results
1
2
3
4
5
6
7
8
9
10
11
12
13
14
15
16
17
18
19
20
21
22
23
24
25
26
27
28
29
30
31
32
%% improt dat and plot MC results
clear;clc;
addpath('/home/Div6/research/zhangray16/sim_results/DRAM_CIM/4TDRAM_CIM');
filname = 'ExplorerRun_0_transpose.csv';

% preview & read data
opts = detectImportOptions(filname);
preview(filname,opts) %preview data, optional
D = readmatrix(filname);
[N,M] = size(D);
% get interested data
D = D(:,7:8);
[N,M] = size(D);
% separate data
var = 0:100; %sweep range or point in MC simulation
run = 200; %number of runs in MC suimulation
D1 = reshape(D(:,1),run,size(var,2)); %reshape data
D2 = reshape(D(:,2),run,size(var,2));
% replace Nan data with mean value (in case of sim error during MC simulation)
nmean = nanmean(D1); %mean excluding NaN (nanmean function is not recommended)
nmean = mean(D1,'omitnan'); %mean excluding NaN
D1(isnan(D1)) = nmean(ceil(find(isnan(D1))/run));
nmean = mean(D2,'omitnan');
D2(isnan(D2)) = nmean(ceil(find(isnan(D2))/run));

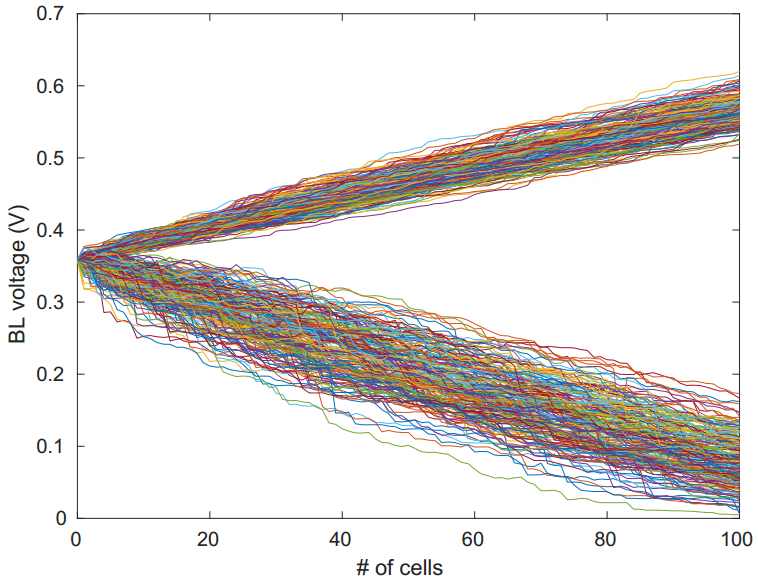
% plot results
figure
plot(var,D1);
hold on;
plot(var,D2);
xlabel({'# of cells'});
ylabel({'BL voltage (V)'});
