可以用于paper的图片设置
Code
1
2
3
4
5
6
7
8
9
10
11
12
13
14
15
16
17
18
19
20
21
22
23
24
25
26
% This is from startup.m (on website)
% Plot formattingcolordef white;
% Plot with default font size 16+
% Linewidth of 2 or 3
set(0,'defaultAxesFontName', 'Arial', ...
'defaultTextFontName', 'Arial', ...
'defaultAxesFontWeight', 'Bold', ...
'defaultTextFontWeight', 'Bold', ...
'DefaultTextFontSize', 16, ...
'DefaultAxesFontSize', 16, ...
'DefaultLineLineWidth', 3.0, ...
'DefaultAxesLineWidth', 3, ...
'DefaultPatchLineWidth', 2, ...
'DefaultAxesXGrid', 'on', ...
'DefaultAxesYGrid', 'on');
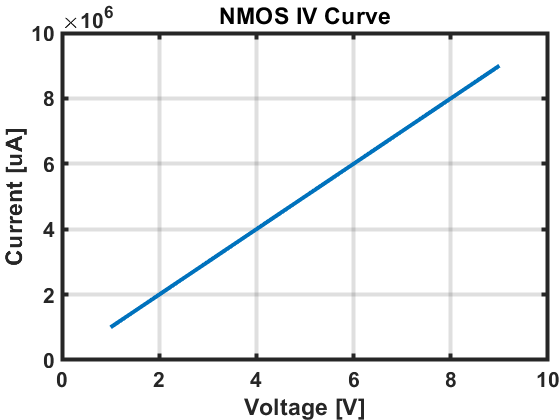
% Loading/plotting data
% data = csvread('nmos_iv_data.csv', 1);
data = [1:9; 1:9]';
voltage = data(:,1);
current = data(:,2)*1e6;
plot(voltage, current);
xlabel('Voltage [V]');
ylabel('Current [uA]');
title('NMOS IV Curve');
显示效果如下: