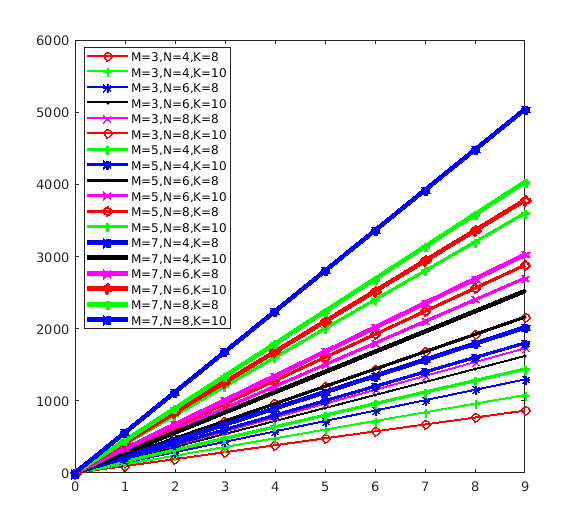
How To Generate Legends for Figures Plotted in Loops
Code
1
2
3
4
5
6
7
8
9
10
11
12
13
14
15
16
17
18
19
20
21
22
23
24
25
% clear;clc;
i = 0; % for legend_str
figure('name','plot in loops')
LineStyle = '-';
Marker = 'o+*.x';
Color = 'rgbkm';
% condition loop
for m = 3:2:7
    for n = 4:2:8
        for k = 8:2:10
            % data
            x = 0:1:9;
            y = m*n*k*x;
            %plot
            plot(x,y,...
                'LineWidth',m*0.5, ...
                'Marker',Marker(mod(i,5)+1),...
                'Color',Color(mod(i,5)+1));
            hold on;
            i=i+1;
            legend_str{i} = ['M=', num2str(m), ',N=', num2str(n), ',K=', num2str(k)];
        end
    end
end
legend(legend_str);
