1
2
3
4
5
6
7
8
9
10
11
12
13
14
15
16
17
18
19
20
21
22
23
24
25
26
27
28
29
30
31
32
33
34
35
36
37
38
39
40
41
42
43
44
45
46
47
48
49
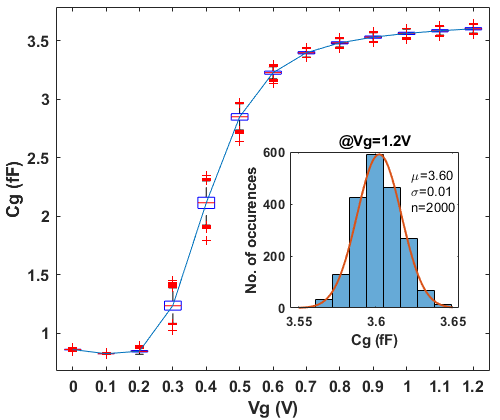
| % import data
A = importdata('cap_sweep.csv');
v = A.data(:,1);
c = A.data(:,4).*1e15;
figure
boxplot(c,v); % sample boxplot with grouping
hAx=gca; % retrieve the axes handle
xtk=hAx.XTick; % and the xtick values to plot() at...
% vg = 0:0.1:1.2;
% xtick = sprintfc('%g',vg);
% xticklabels(xtick);
hold on
cc = zeros(2000,13);
for n = 1:1:13
cc(1:2000,n) = c((n-1)*2000+1:n*2000);
end
line(xtk,mean(cc))
% line(xtk,mean(cc),'Color','red','LineStyle','--')
xlabel('Vg (V)');
ylabel('Cg (fF)');
set(gca,'FontName','Arial','FontWeight', 'Bold','FontSize',12);
% #### Subfigure: histogram
% import data
A = importdata('cap.csv');
c = A.data(:,3)*1e15;
hold on
axes('position',[0.55,0.25,0.3,0.35]);
nbins = 9;
h1=histogram(c,nbins);
hold on
x = 3.55:0.001:3.65;
[mu,sigma]=normfit(c);
f = exp(-(x-mu).^2./(2*sigma^2))./(sigma*sqrt(2*pi));
y=f/max(f)*max(h1.Values);
plot(x,y,'LineWidth',1.5)
xlabel('Cg (fF)');
ylabel('No. of occurences');
title('@Vg=1.2V')
set(gca,'FontName','Arial','FontWeight', 'Bold','FontSize',10);
text(3.623,450, ...
{strcat('\mu=', num2str(mu,'%1.2f')); ...
strcat('\sigma=', num2str(sigma,'%1.2f')); ...
strcat('n=', num2str(2000))}, ...
'FontName','Arial','FontSize',10);
|
