This post shows how to analyze spectrum features, which is useful when running ADC/DAC simulations.
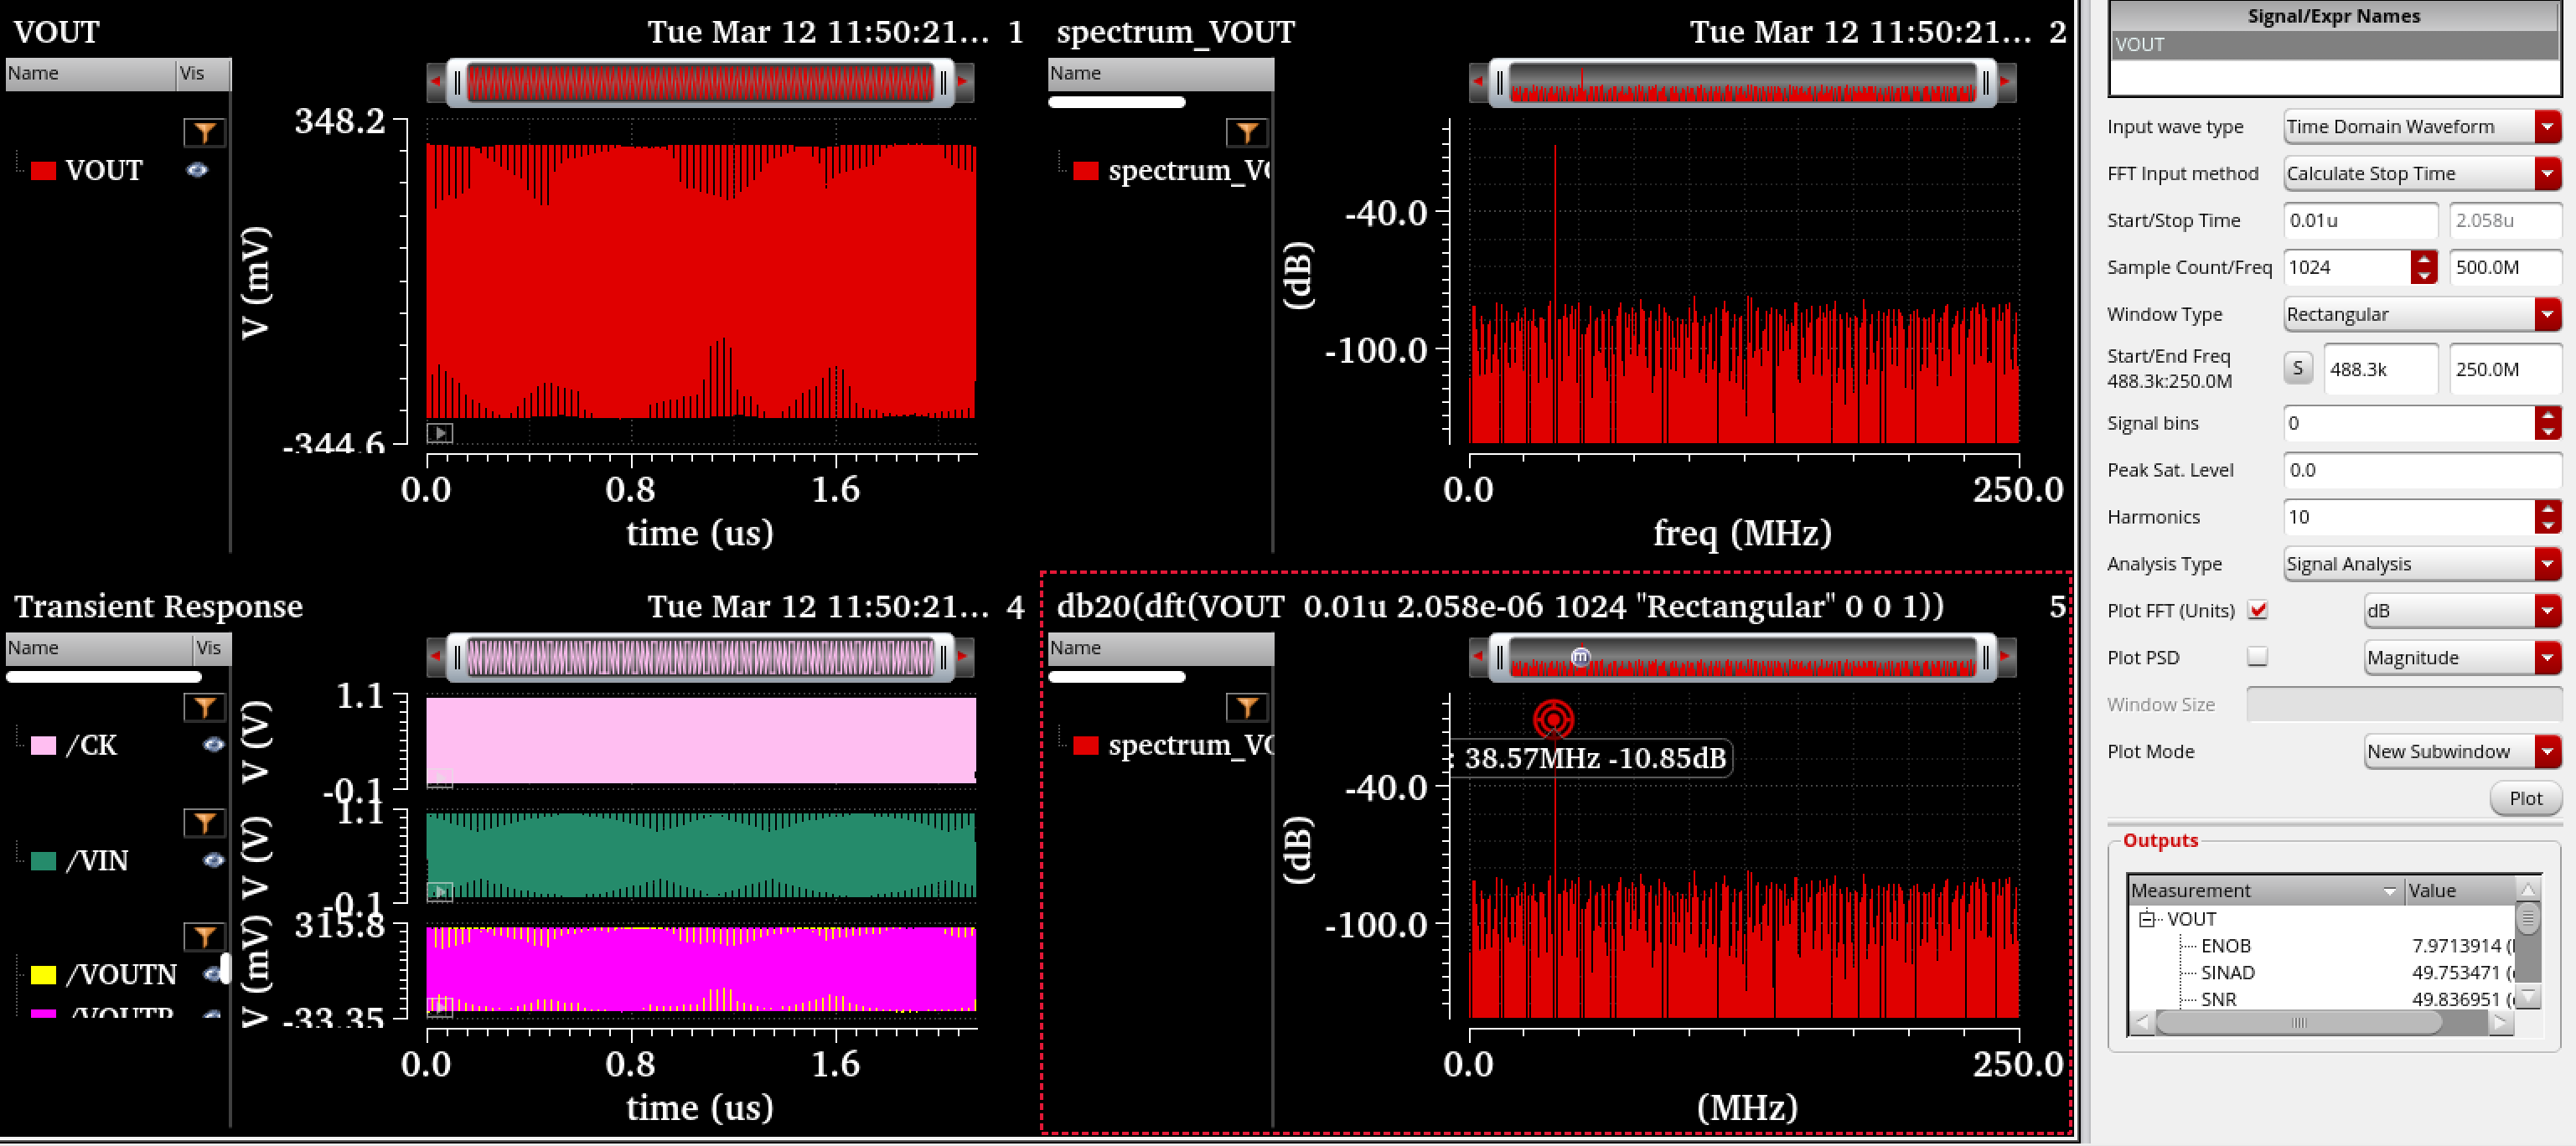
Here is an example of an 8-bit DAC simulation.
- Plot the output analog signal (use the differential signal if the outputs are differential)
- In the Viva window, click
Measurementsand selectSpectrum.![Viva Spectrum avatar]()
- Select
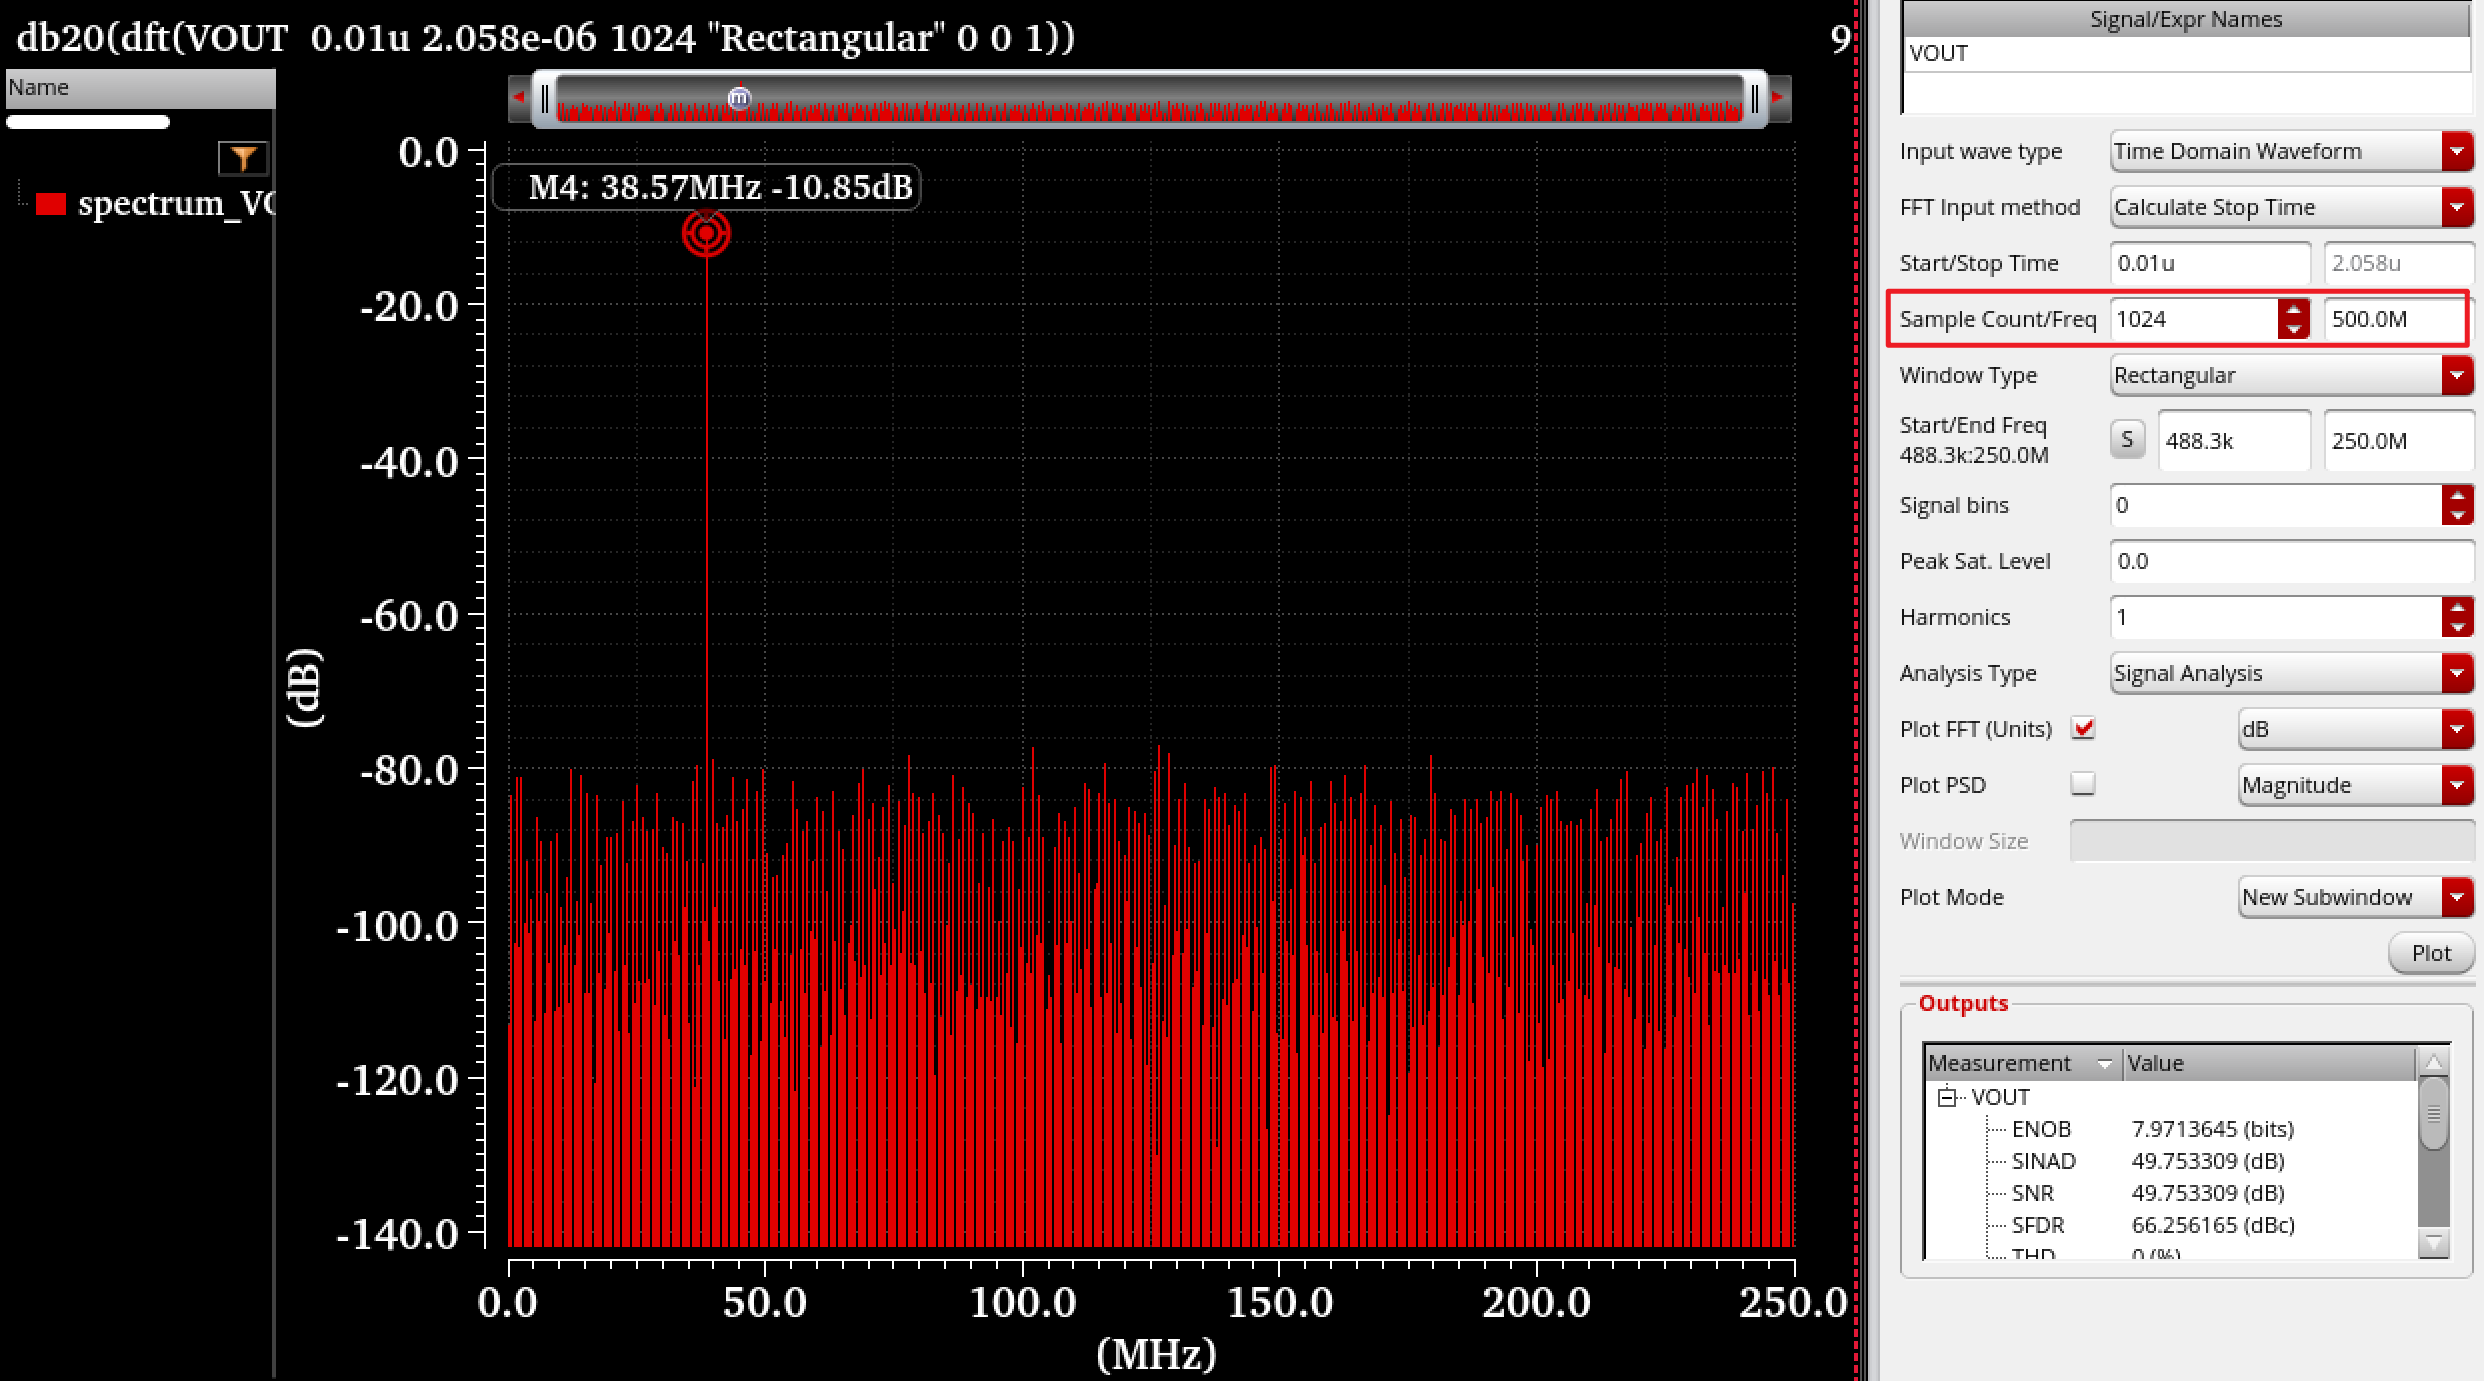
Calculate Stop Time(make sure the simulation time is enough) - Set sample count and frequency according to simulation settings
- Click
Sto get the Start/End frequency - Click
Plotto get results
- In the output window at the bottom right, select one item and right-click to send it to ADE. Then you can edit the equation using variables so that you don’t need to modify the equation after changing the variables.
![Spectrum Calculation avatar]()
The format of ENOB is as follows:
spectrumMeasurement(analog_signal t t_start t_stop number_of_samples 0 half_of_sample_fre) 0 “Rectangular” 0.0 0 number_of_harmonics “enob”)
Note
通常,对AD/DA进行频谱分析,只看在奈奎斯特带宽内(直流至fs/2)的信号和谐波。
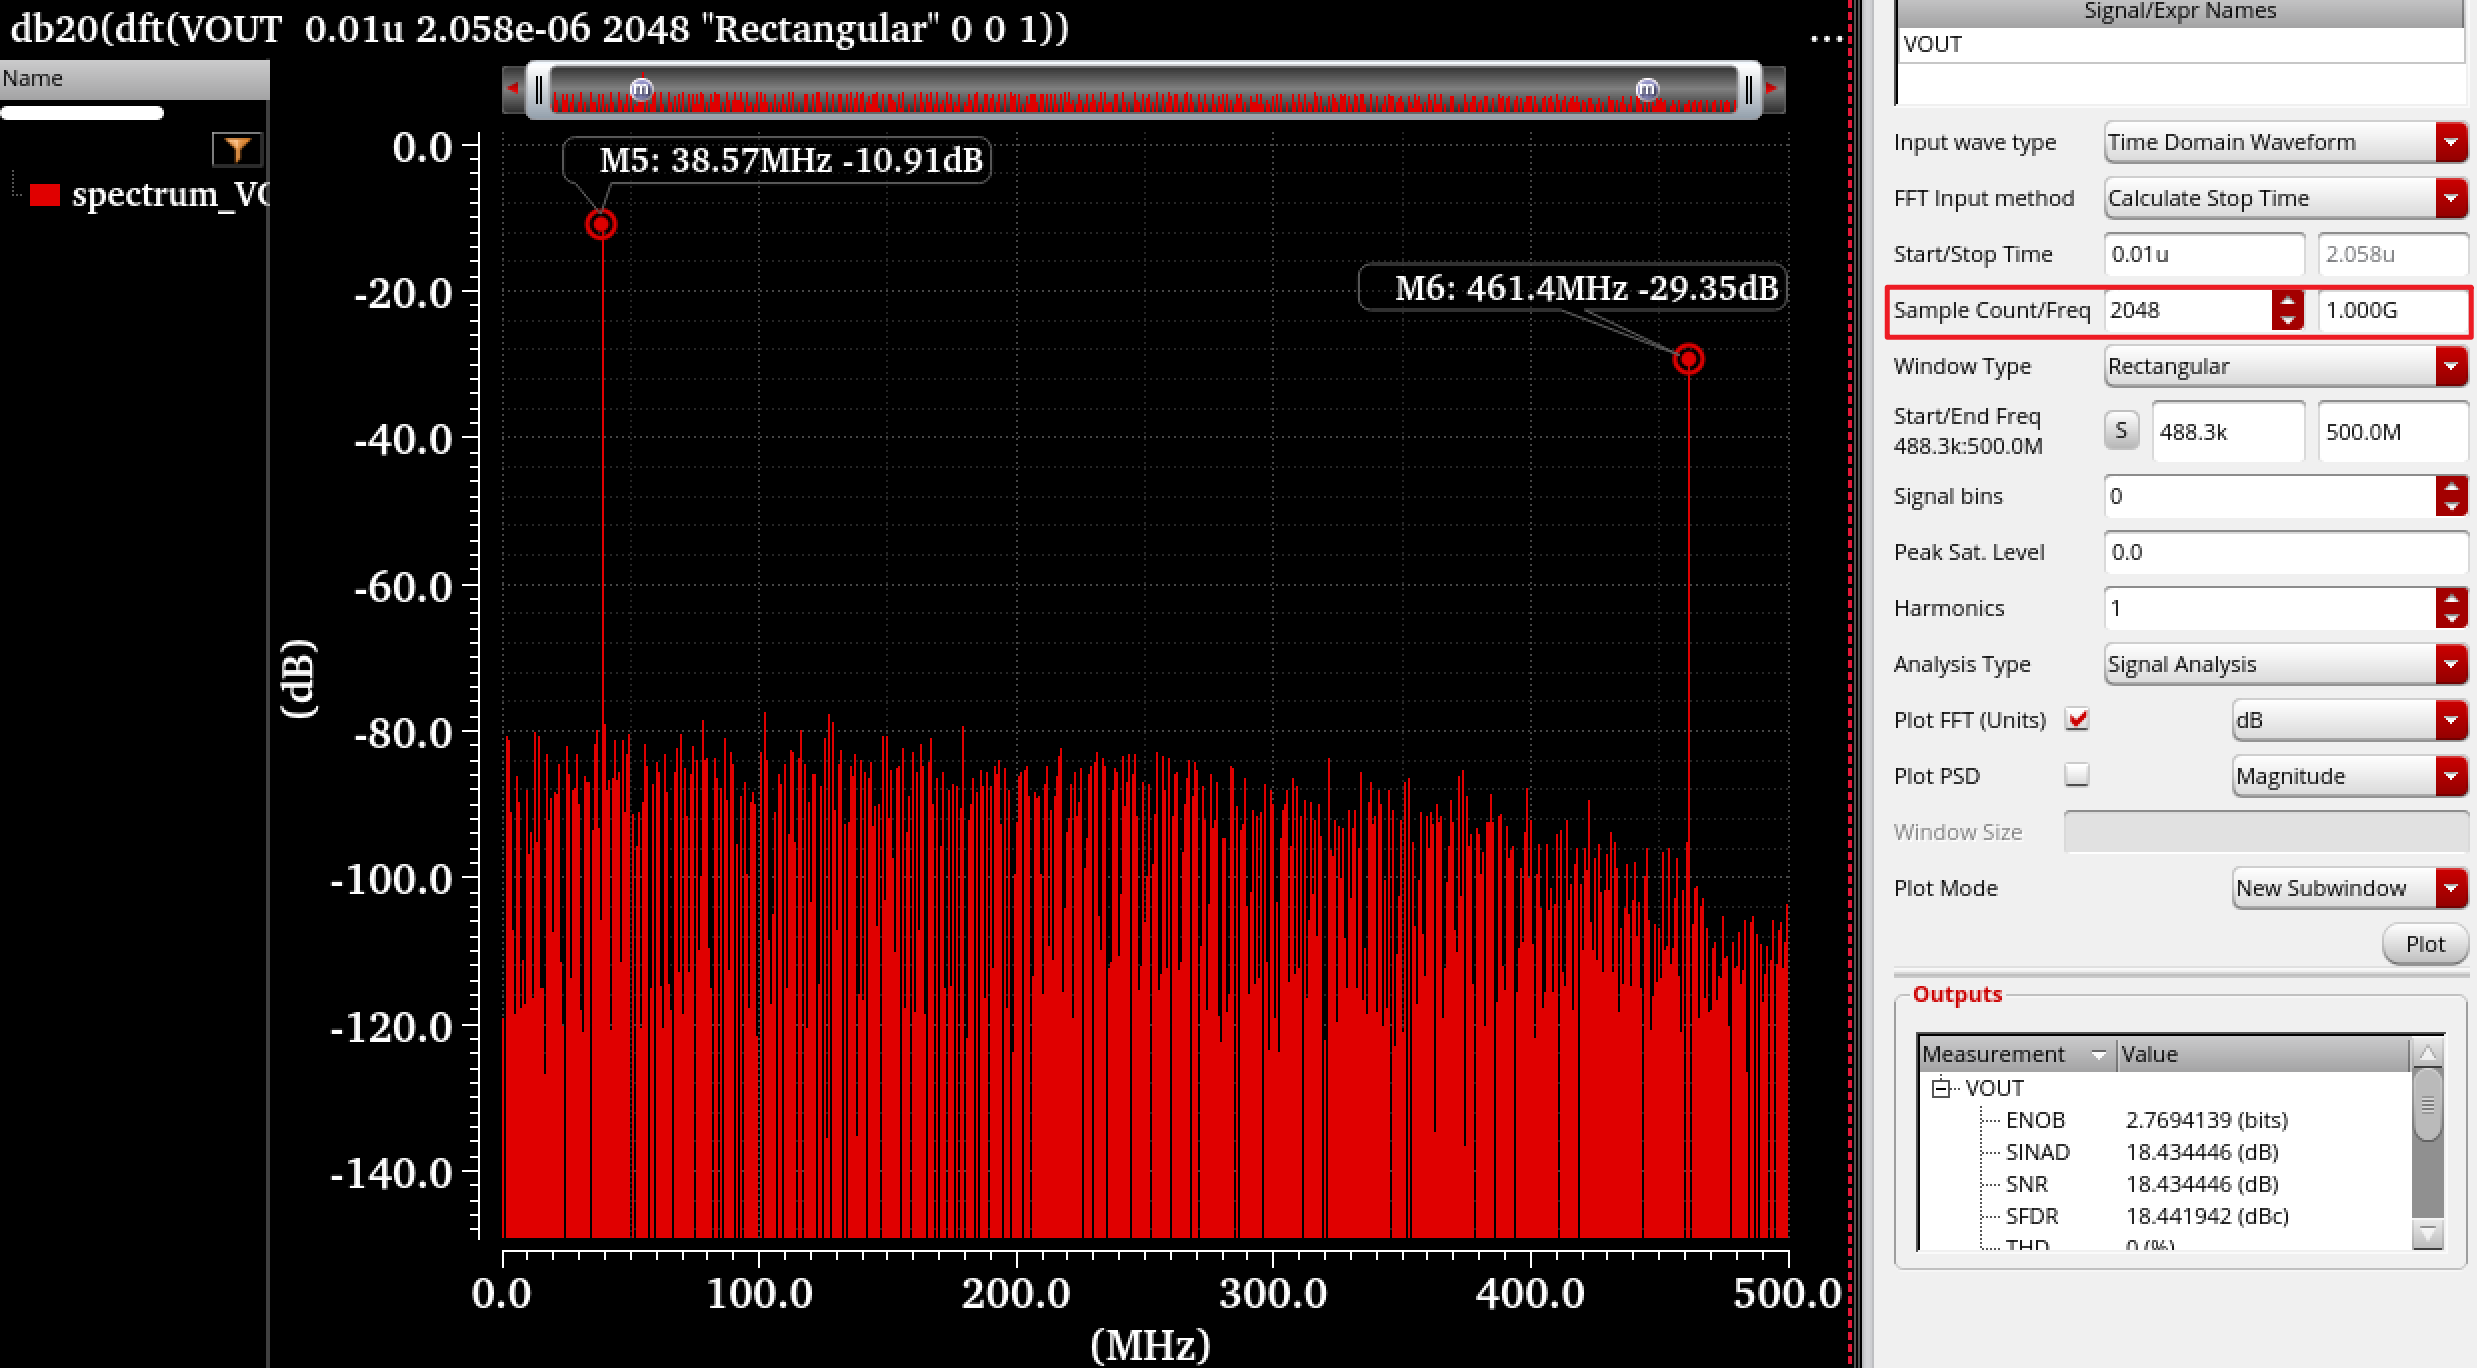
比如,这里采样频率fs=500MHz,频谱上输出频率只到250MHz。这个时候可以得到正确的动态性能,如ENOB, SFDR等。 
但是实际上,高频处存在镜像频率(image frequency),f_img = fs - fo。这里存在一个500M-38.6M = 461.4MHz的混叠频率。 因此,后级需要一个LPF滤除杂散频率成分。 

